

October 2026 Central Texas Real Estate Market Update
More homes remain available across the Austin area than buyers saw a few years ago, but October brought fewer sales and lower median prices than the same month last year. Here’s what the latest numbers mean for buyers and sellers across Central Texas.
October at a glance: what changed in the Central Texas housing market?
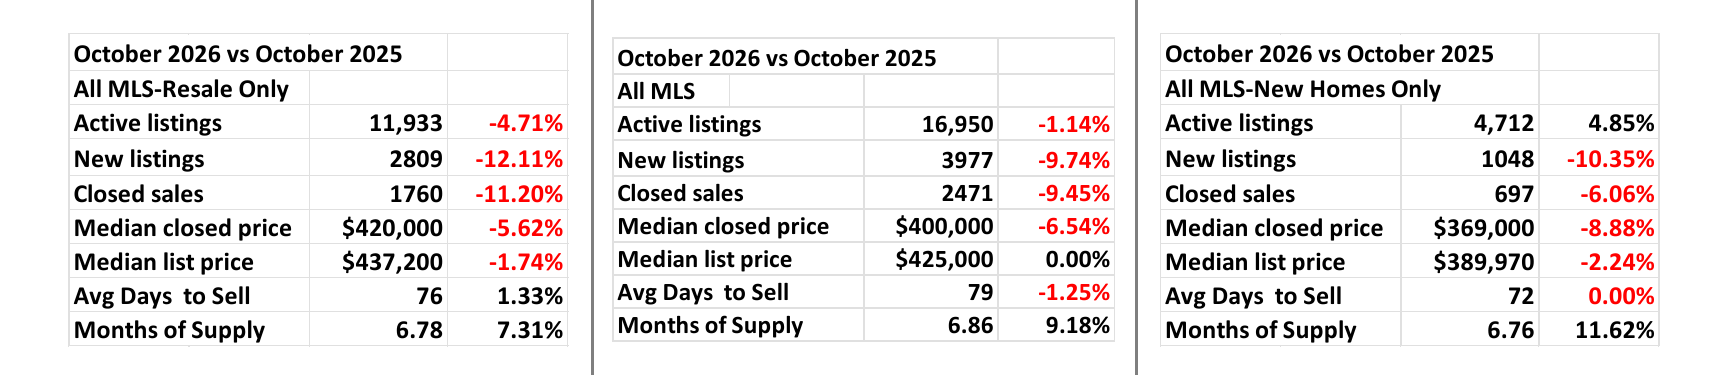
October 2026 closed with 16,950 active listings across the MLS, down 1.14% from October 2025. There were 3,977 new listings, a 9.74% decrease, and 2,471 closed sales, down 9.45% year over year. The median closed price was $400,000, down 6.54% from a year ago, while the median list price held steady at $425,000.
Homes took an average of 79 days to sell, and the market reached 6.86 months of supply, up 9.18% compared with October 2025. Together, the numbers point to a market where buyers have options, while sellers need to pay close attention to pricing and the homes competing for attention.

Resale homes and new construction: how do they compare?
The resale and new-home markets did not move in exactly the same way during October. For resale homes, active listings totaled 11,933, down 4.71% from last October. New listings fell 12.11% to 2,809, while closed sales declined 11.20% to 1,760. The median resale closing price was $420,000, down 5.62% year over year. Resale homes averaged 76 days to sell and had 6.78 months of supply.
New construction had 4,712 active listings, up 4.85% from October 2025. However, new listings were down 10.35%, and closed sales decreased 6.06% to 697. The median closed price for new homes was $369,000, down 8.88% year over year. New homes averaged 72 days to sell and had 6.76 months of supply.
For buyers, comparing resale homes with new construction may be especially worthwhile. A resale property may offer an established neighborhood, mature landscaping or a location closer to existing amenities. New-home communities may offer builder incentives, warranties or opportunities to personalize finishes. The best fit depends on the home, location, total cost and terms—not simply whether it is new or resale.
How today’s market compares with the past six Octobers
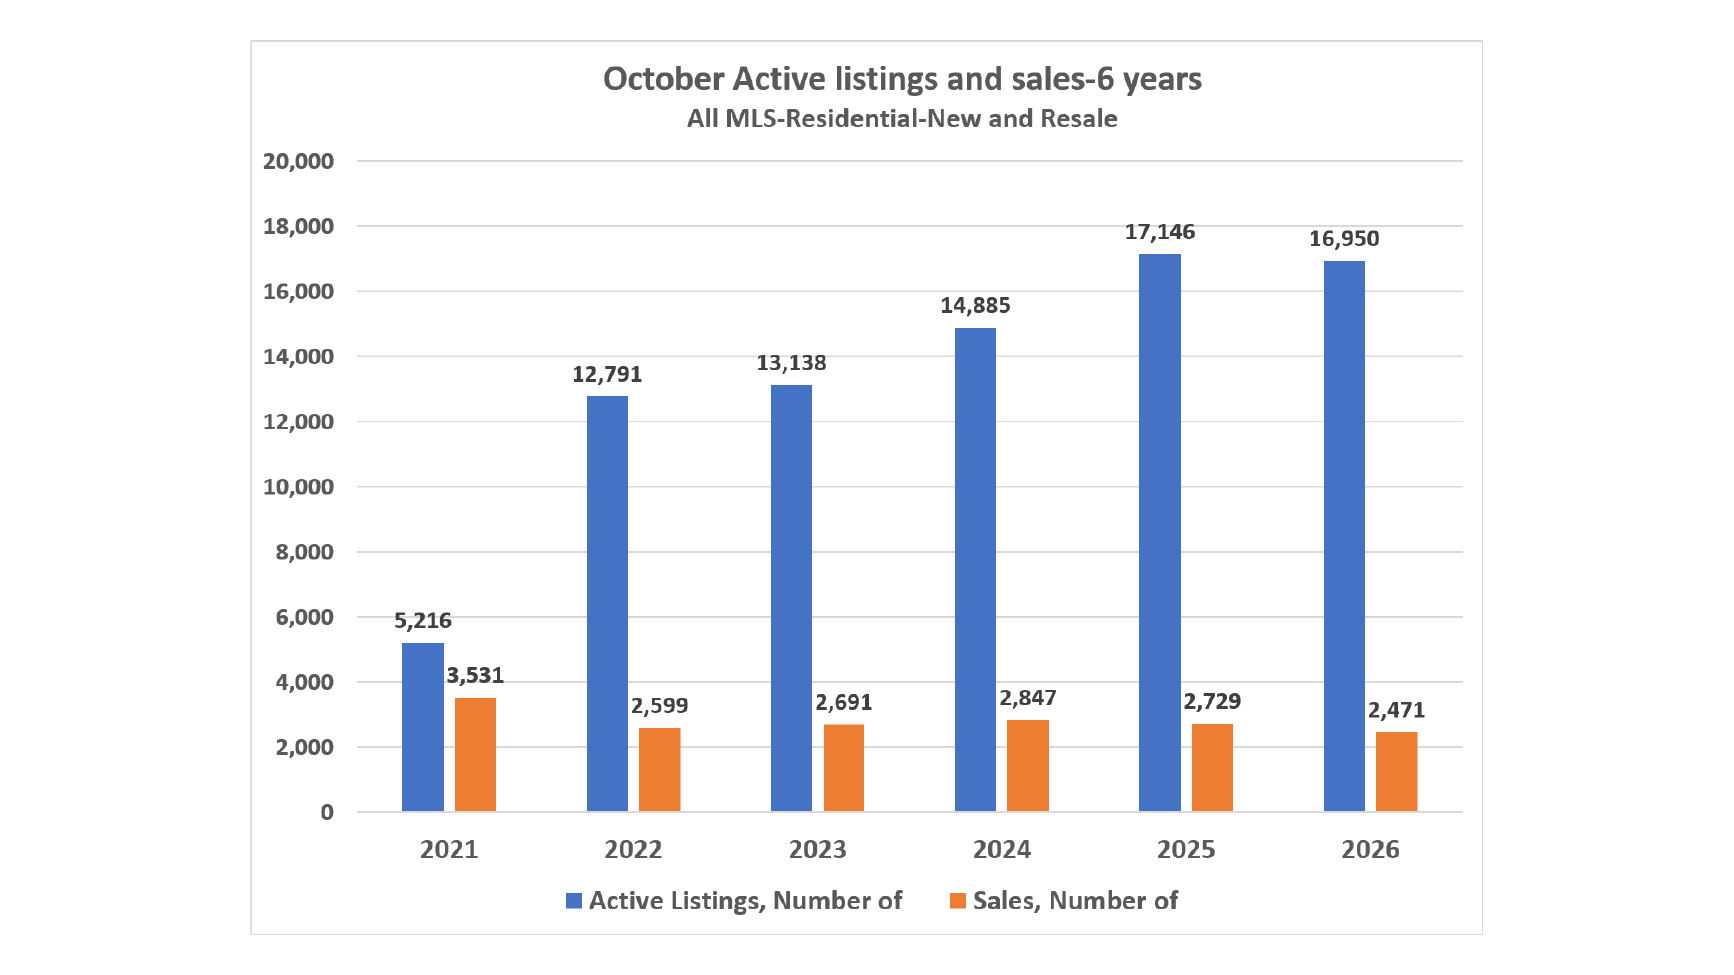
The six-year chart puts this month's numbers into perspective. In October 2021, the MLS recorded 5,216 active listings and 3,531 closed sales. By October 2026, active listings had climbed to 16,950, while closed sales had moved down to 2,471.
Inventory increased sharply between October 2021 and October 2022, then continued to rise over the following years. Active listings reached 17,146 in October 2025 before easing slightly to 16,950 this October. Closed sales, meanwhile, have remained below the October 2021 level in every year shown. They increased from 2,599 in 2022 to 2,847 in 2024, then declined to 2,729 in 2025 and 2,471 in 2026.
In everyday terms, buyers have a much larger pool of homes to consider than they did in 2021. Sellers are competing in a market with more available choices, even though active listings are a little lower than they were last October. That makes it important to understand the number, condition and pricing of similar homes in a specific neighborhood.
What does 6.86 months of supply mean for buyers and sellers?
Months of supply is a way to measure how the number of homes available compares with the recent pace of sales. It estimates how long the current inventory would take to sell if no additional homes came on the market and sales continued at the same pace. It does not mean every individual home will take that long to sell.
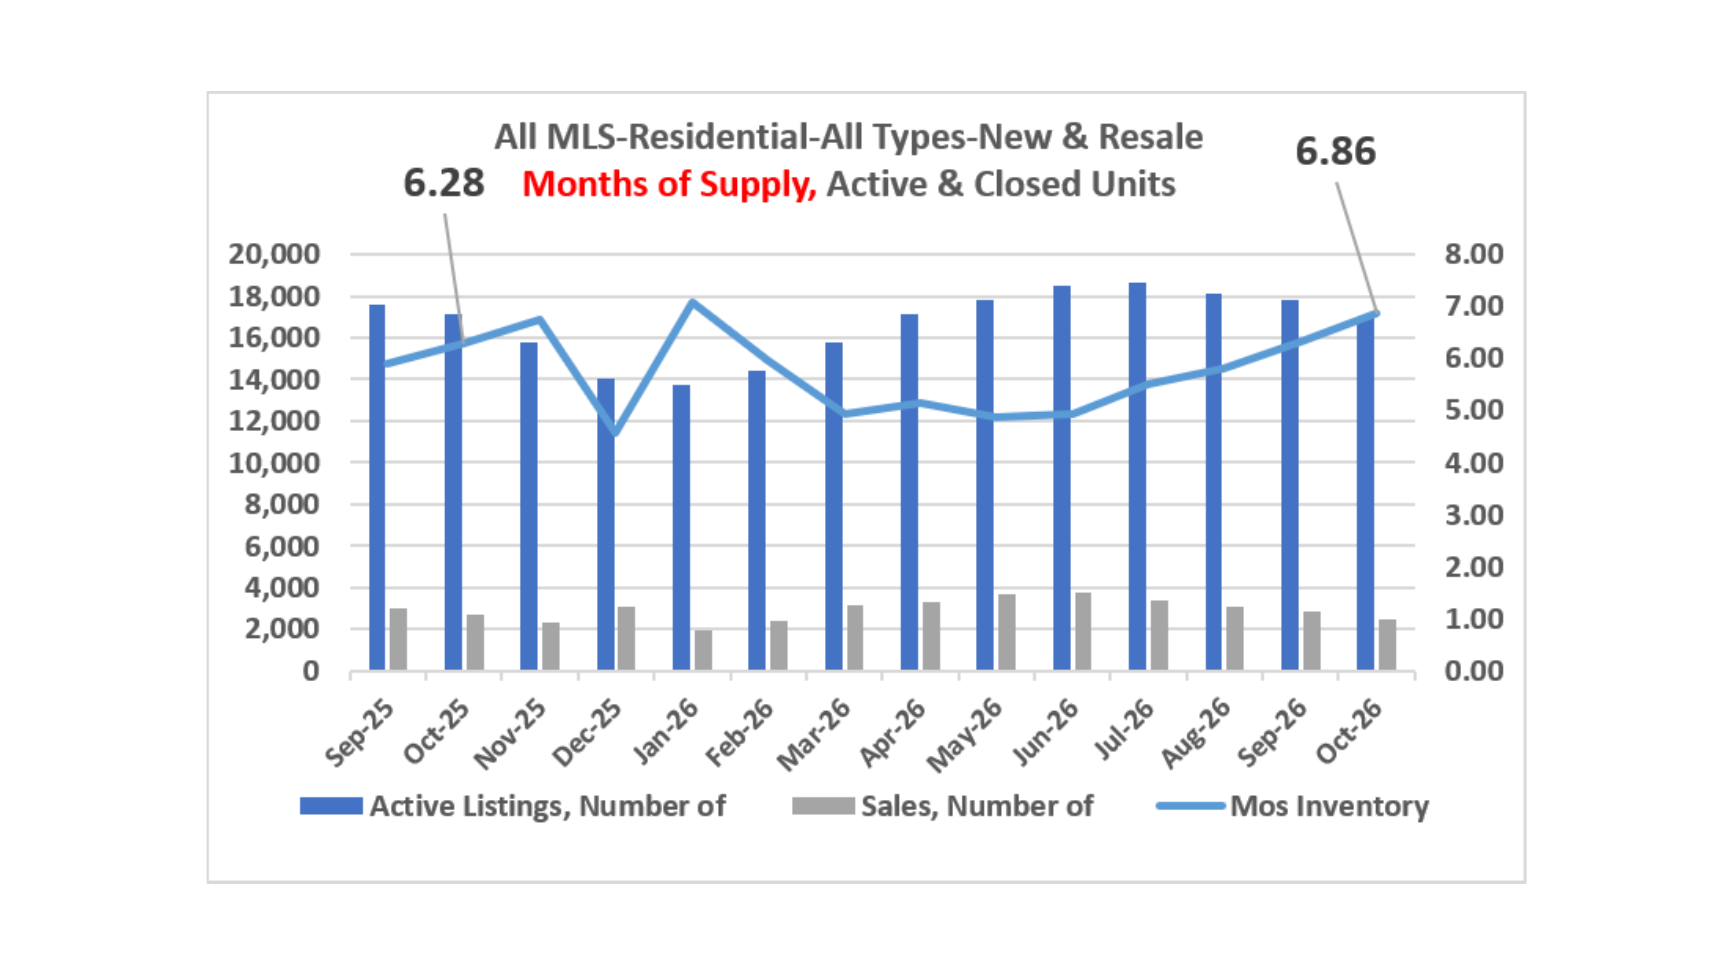
In October 2026, all-MLS months of supply reached 6.86 months, compared with 6.28 months in October 2025. The chart tracking the past 14 months shows supply fluctuating during the year, dipping in some winter and spring months before trending upward again through the summer and fall.
For buyers, a higher months-of-supply figure can mean more homes to compare and potentially more room to negotiate, depending on the property and seller. For sellers, more supply means buyers can be selective. A thoughtful pricing strategy, strong photography, careful preparation and a plan for responding to feedback can help a home stand out.
What October’s numbers could mean if you’re buying or selling
If you’re thinking about buying
October’s numbers suggest buyers have more choices than they did several years ago. Take time to compare homes, evaluate resale and new construction options, and look closely at recent sales in the areas you’re considering. Ask about seller concessions or builder incentives where appropriate, and make sure the monthly payment and overall cost fit your plans.
If you’re thinking about selling
More available homes mean buyers can compare price, condition and features before deciding which properties to visit. Before listing, review the homes currently competing with yours and the properties that have recently sold. Pricing realistically from the start and presenting the home well can help attract serious interest.
A closer look at the Central Texas real estate market
These October statistics provide a broad view of residential real estate across the MLS, but the market can look different from one community to the next. Conditions in Austin may differ from Cedar Park, Leander, Round Rock, Georgetown, Pflugerville, Hutto, Liberty Hill and other Central Texas communities. Price range, property type, neighborhood and condition all matter.
Whether you’re preparing to buy a home, considering selling, or simply keeping an eye on the Austin-area housing market, Realty Capital City can help you understand the local numbers and how they relate to your plans.
Connect with Realty Capital City for a conversation about current market conditions, comparable sales and your next steps in the Central Texas real estate market.
Market data reflects the October 2026 MLS report supplied for this article. Figures are regional and should not be interpreted as a guarantee of results for an individual property or neighborhood.